발효차의 미생물 대사체 분석에 관한 연구
Abstract
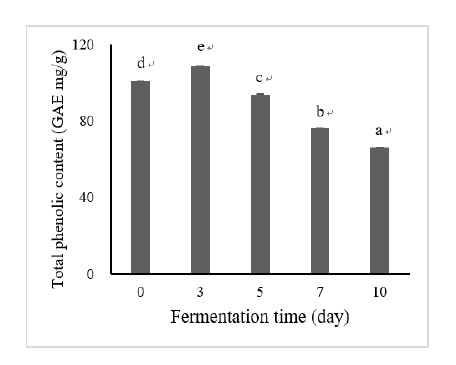
The objective of this study was to produce high-quality microbial fermented tea by isolating and identifying microorganisms from nuruk. The isolated microorganisms were analyzed by internal transcribed spacer (ITS) region sequencing and the isolate was identified as Aspergillus sp. B3. Tea leaves were then inoculated with the identified microorganism. The changes were observed and the metabolites formed were analyzed according to the fermentation period. The total polyphenol content of the fermented tea was measured on day 0, 3, 5, 7, 10, a total of 5 times. The total polyphenol content decreased by 35% on day 10 compared to the initial content before inoculation on day 0. A total of 28 metabolites were identified in the fermented tea with the results of the PLS-DA score plot and those of UPLC-Q-TOF MS, using LC/MS, and GC/MS analyses. As fermentation progressed, the content of simple sugars, organic acids, and catechin-based substances decreased, and those of sugar alcohols increased. The content of glutamine increased significantly among the amino acids present, whereas those of alanine, serine, threonine, aspartic acid, and 5-oxoproline decreased. Furthermore, the fermented tea showed increased levels of several fatty acids, including lysophosphatidylcholine (LPC 18:1, LPC 18:2, and LPC 18:3), but the levels of palmitic acid, stearic acid, glycerol, and 13-docosenamide remained unaffected. The results of this study could be used as basic research data for further analyses of fermented teas using Aspergillus sp. B3 and their secondary metabolites and could also have an influence on the production of Korean-style microbial fermented teas through studies of a variety of such teas according to their fermentation period.
Keywords:
Aspergillus sp, microbial-fermented tea, metabolite analysis, polyphenol content서 론
차 가공 과정에서 발효는 찻잎을 일정한 환경 조건에서 함유물질, 특히 폴리페놀의 적절한 화학적 변화를 유도하는 공정이다(Ryu KH 등 2012). 차의 발효는 크게 두 가지의 의미로 나눌 수 있는데, 하나는 미생물을 접종한 발효차와 다른 하나는 자연적인 산화에 의한 발효차가 있다(Kim YS 등 2010). 차는 발효 여부와 정도에 따라 비발효차, 반발효차, 완전발효차, 후발효차 등으로 구분하며, 발효차는 제다방법에 따라 청차, 황차, 홍차, 흑차로 구분할 수 있다(Choi OJ & Choi KH 2003). 비발효차는 찻잎을 가마솥에서 덖어서 찻잎의 효소를 불활성화한 녹차를 말하고, 반발효차는 제다과정에서 시들기와 유념을 하여 찻잎 중의 폴리페놀 성분을 10%∼60% 정도 산화하여 만든 차를 말하며, 완전발효차는 찻잎의 폴리페놀 성분을 85% 이상 산화하여 만든 차를 말한다(Ryu KH 등 2012). 후발효차는 산화 발효차와 미생물 발효차로 구분한다. 현재 가장 많이 알려진 후발효차는 중국의 보이차가 있으며, 우리나라는 동전차가 있다.
찻잎은 자체적으로 청엽알코올 등 상쾌한 향을 기본적으로 가지고 있다. 차를 만드는 과정에서 조금씩 변화하여 여러가지 향기 성분이 조화된 복잡한 향을 만들어 내는 것으로 알려져 있다(Lee JY 등 2007). 차는 발효과정에서 떫은맛을 내는 카테킨이 테아플라빈류로 변화하면서 독특한 색과 향, 맛을 나타낸다(Kim SH 등 2014). 찻잎의 성분에는 폴리페놀류, 알칼로이드(카페인), 아미노산, 유기산, 지방산, 향기성분과 비타민 A, C, E 등이 있으며, 이러한 성분의 함량과 조성에 따라 발효과정 중에 차의 맛이 달라진다(Terada S 등 1987; Choi OJ & Choi KH 2003; Kim MG 등 2016). 차에 함유되어 있는 폴리페놀에는 플라본, 플라보놀, 플라바놀, 안토시아닌, 페놀산이 있으며, 그 중에서도 카테킨(catechin)은 찻잎에 함유된 폴리페놀의 50% 이상을 차지한다. 찻잎에 함유된 주요 카테킨류는 catechin(C), epicatechin(EC), epigallocatechin(EGC), epicatechingallate(ECG), epigallocatechingallate(EGCG)가 있으며, 제다과정에서 카테킨의 산화중합 반응에 의해 생성되는 2차적 대사물질인 테아플라빈류(theaflavins), 테아루비긴류(thearubigins), 테아브라우닌류(theabrownines) 등은 차의 색이나 맛에 중요한 역할을 한다(Terada S 등 1987; Lee SJ 등 2015). 차에 다양하게 함유된 폴리페놀류는 항산화, 항암, 항염증, 항지질 효과 등의 생리활성이 있는 것으로 알려져 있으며(Kim MG 등 2016), 발효차의 섭취 빈도가 높을수록 성인여성의 체질량지수가 낮고, 우울 정도가 낮다는 연구결과도 보고되었다(Jung YM & Choi MJ 2019). 그러나 지금까지 우리나라에서 이루어진 차 연구들은 녹차의 성분과 기능성(Sung KC 2006)을 중심으로 이루어졌고(Oh CK 등 2000; Sung KC 2006), 산화효소에 의한 발효차의 성분과 생리활성에 대한 연구가 대부분이었으며(Gomes A 등 1995; Feng Q 등 2002; Kuo KL 등 2005), 미생물을 이용한 발효차 연구는 제한적이었다(Lee SJ 등 2015). 식품의 발효에 이용되는 미생물은 바실러스(Bacillus), 유산균(lactic acid bacteria), 효모(Saccharomyces), 곰팡이(Aspergillus) 등이 있다(Kim SY 등 2016). 미생물 발효를 통한 발효차의 생리활성에 대한 연구들은 Eurotium sp.(Lee SJ 등 2015), Bacillus sp.(Lee SY 등 2013), Monascus sp.(Lee SI 등 2012), Lactobacillus sp.(Park JH 등 2012)를 이용하여 제조한 발효차에 관한 연구가 보고된 바 있다. 그러나 누룩에 있는 균을 이용한 발효차의 연구는 미흡했다.
본 연구는 새로운 미생물 발효차를 연구하기 위해서 누룩으로부터 미생물을 분리하여 동정하였는데, Aspergillus sp. 균으로 동정되었다. 동정한 미생물을 찻잎에 접종하여 발효기간에 따라 미생물이 생성하는 대사체를 분석하여 새로운 국내산 미생물 발효차의 특성을 연구하고자 하였다.
재료 및 방법
1. 균주 분리 및 배양
누룩에서 분리한 곰팡이는 PDA 평판배지에서 배양하고, 다시 PDA 액체배지에 3조각(5 mm × 5 mm)을 접종하여 25℃에서 3일간 정치배양을 한 후, 물기를 제거한 곰팡이는 액체질소로 동결한 후 막자사발로 곱게 분쇄하여 genomic DNA (G-DNA) 분리에 사용하였다. G-DNA는 Qiagen DNA mini kit(Qiagen, Hilden, Germany)를 이용하여 분리하였으며, 분리한 G-DNA는 곰팡이의 DNA 바코드 분석에 이용하였다.
2. 곰팡이균 동정을 위한 ITS 분석
곰팡이균을 동정하기 위하여 PCR 방법으로 ITS(internal transcribed spacer)영역을 증폭하였다. ITS영역을 증폭하기 위하여 forward primer로서 ITS1(5´-TCCGTAGGTGAACCTGCGC-3´)과 reverse primer ITS4(5´-TCCTCCGCTTATTGATATGC-3´)를 이용하였다. PCR반응액은 G-DNA 1 μL, 2.5mM dNTPs 3 μL, 10×반응버퍼 3 μL, 각 프라이머(100 pmol/μL) 0.3 μL, Hot taq polymerase(Qiagen, Hilden, Germany) 0.3μL에 물을 첨가하여 최종부피가 30 μL가 되게 조성하고, PCR은 94℃에서 15분간 1사이클을 실시한 후 94℃에서 1분, 55℃에서 1분, 72℃에서 1분간의 조건으로 총 35사이클을 실시하였다. 그 후 최종적으로 72℃에서 10분간 1사이클을 실시하였다. PCR산물은 1.5% 아가로스겔 상에 전기영동한 후 DNA정제 kit(Bioneer AccuPrep PCR/Gel DNA purification kit, Bioneer, Daejeon, Korea)를 이용하여 정제하고, 정제한 DNA는 pGEM-T Easy(promega, Madison, WA, USA)벡터와 ligation 하여 대장균 DH5α에 형질 전환 하였다. 대장균으로부터 플라스미드의 분리는 바이오니아 AccuPrep Plasmid Mini Extraction Kit를 이용하고, Insert의 삽입 유무는 제한효소 EcoRI(Takara, Shiga, Japan)를 처리하여 확인하였다. DNA의 삽입이 확인된 DNA는 염기서열 분석에 이용하였다. 염기서열은 Xenotech(Xenotech, Daejeon, Korea)사에 의뢰하여 분석하였다. ITS염기서열을 통한 균의 동정은 BOLDSYSTEMS(www.boldsystems.org)에 내장되어 있는 Fungal Identification(ITS) 프로그램을 이용하였다. ITS 염기서열을 이용한 phylogenetic tree 분석은 Molecular Evolutionary Genetics Analysis X(MEGA X) 프로그램 Xenotech를 이용하였다(Tamura K 등 2011). Branching 패턴의 신뢰성을 확보하기 위해 1,000번의 무작위 샘플링 추출 방법을 통해 얻은 값으로 Bootstrap 분석을 하였다.
3. 발효차 제조 방법
본 연구는 2019년 5월 초 사천시 곤양면 다솔사 소재 산지에 있는 차 밭에서 채취한 찻잎을 발효 차 제조에 사용하였다. 채취한 찻잎은 차 밭 곁에서 채반에 널어 햇빛을 쬐며 20℃∼25℃에서 3시간 가량 시들기한 후 10분 동안 유념을 하고 건조하였다. 건조한 찻잎 10 g과 증류수 8 mL를 250mL 삼각 플라스크에 넣어 고압멸균기로 121℃에서 15분간 멸균 후에 포자(1.5 × 10⁷ CFU/g)를 접종하고, 30℃에서 0, 3, 5, 7, 10일 발효시켰다. 발효된 찻잎은 24시간 건조(35℃±2℃)하여 성분 분석에 사용하였다.
4. 발효차의 분석
대사체를 분석하기 위하여 동결 건조한 시료를 표준물질(terfenadien)이 들어 있는 70% methanol로 혼합한 후 bullet blender(Next Advance, NY, USA)로 25℃에서 10분 간 추출하고, 14,000 rpm에서 10분간 원심분리 후 상층액을 UPLC-Q-TOF MS(Xevo, Waters, Milford, MA, USA) 분석에 이용하였다. 또한, GC/MS를 이용하여 발효차에 들어있는 대사물질들을 분석하기 위하여 80% methanol로 추출한 발효차 추출물을 CentriVap vacuum concentrator(LABCONCO Co., Kansas City, MO, USA)를 이용하여 완전히 건조시킨 후, methoxyamine hydrochloride와 N,O-bis(trimethylsilyl) trifluoroacetamide(BSTFA)를 사용한 silylation의 방법을 이용하였다(Kim DW 등 2017). Internal standard로 사용한 dicyclohexyl phthalate가 첨가된 pyridine과 methoxyamine hydrochloride을 넣고 37℃에서 90분간 반응시킨 후 BSTFA을 첨가하고 70℃에서 30분간 반응시킨 유도체화된 추출물은 vial에 옮겨 담아 GC/MS 분석에 이용하였다.
5. 총 페놀화합물 함량 분석
총 페놀화합물 함량은 Folin-Ciocalteu의 방법(Singleton VL 등 1999)을 일부 변형하여 측정하였다. 70% methanol로 추출한 20 μL에 증류수 980 μL와 10% Folin-Ciocalteu reagent 5 mL를 혼합 후 25℃ 암실에서 8분간 반응시킨 후, 7.5% Na2CO3 4 mL를 혼합한 뒤 25℃ 암실에서 1시간 반응시켰다. 반응이 끝난 후 765 nm 흡광도에서 측정하였다. 양성대조군으로 gallic acid를 사용하였으며, 페놀화합물 함량은 gallic acid equivalent(mg GAE/g)로 나타냈다.
6. UPLC-Q-TOF MS 대사체 분석
미생물 발효차 대사체 추출물은 Waters Acquity UPLC-Q-TOF를 이용하여 분석하였다. 시료추출물은 Acquity UPLC BEH C18 컬럼(2.1 mm × 100 mm, 1.7 μm; Waters, Milford, MA, USA)에 주입하였으며, 이동상은 0.1% formic acid를 함유하고 있는 물(A)과 0.1% formic acid를 함유하고 있는 acetonitrile(B)로 flow rate는 0.35 mL/min이며, 컬럼온도는 40℃이었다. 컬럼을 통과하여 나온 eluents는 positive electrospray ionization(ESI) mode를 갖고 있는 Q-TOF MS로 분석하였다. TOF MS data의 scan range는 50-1,500 m/z, scan time은 0.2 s, capillary와 sampling cone voltages는 3 kV와 30 V, desolvation flow rate는 800 L/h, desolvation 온도는 350℃, source 온도는 120℃이었다. Leucine-enkephalin([M+H]= 556.2771)는 lock mass을 위한 reference compound로 사용되었으며, 10 s당 분석되었다. 모든 시료들을 혼합하여 만들어진 quality control(QC) 시료는 매 5개를 분석하였다. MS/MS spectra은 collision energy ramp(10 to 30 eV), m/z 50-1,500 조건하에서 얻었다. m/z, retention time, ion intensity를 포함하는 mass spectrometry data 프로세싱은 MakerLynx software(Waters)를 사용하여 진행하였다.
7. GC/MS 대사체 분석
유도체화한 시료 1 μL는 DB-5 column(30 m × 0.25 mm id, 0.25 μm film thickness; J & W Scientific, Santa Clara, CA, USA)이 연결된 GC로 주입하여 분석을 진행하였다. Carrier gas로 사용된 helium은 1 mL/min 유속으로 흘려보냈으며, injector 온도는 200℃로 유지하였다. 초기 oven 온도를 70℃로 2분간 유지시킨 후 10℃/min 비율로 320℃까지 증가시키고, 동일 온도에서 5분간 유지시켰다. GC column을 통해 분석되어 나오는 물질들은 electron impact(EI) ionization mode(70 eV)로 작동하는 Shimadzu GCMS-TQ 8030(Tokyo, Japan)로 분석하였다. Ion source와 interface 온도는 각각 230℃와 280℃였으며, GC column을 통해 분석되어 나오는 물질들은 full scan mode(m/z 45-550)로 모니터링되었으며 scan event time과 scan 속도는 각각 0.3 sec와 2,000 u/sec이었다. Detector voltage는 0.1 kV이고, threshold은 100을 사용하였다.
8. 대사체 자료 분석
UPLC-Q-TOF MS를 이용하여 얻어진 LC-MS data의 collection, normalization, alignment는 UNIFI version 1.8.2 프로그램(Waters)을 이용하여 진행하였다. Peak-to-peak baseline noise(1), noise elimination(6), peak-width(5% height of 1 s), intensity threshold(10,000)를 이용하여 peaks을 얻었으며, mass window(0.05 Da)와 retention time window(0.2 min)를 이용하여 metabolite data를 alignment하였다. 모든 data는 표준물질을 이용하여 normalization하였다. 대사물질들은 UNIFI version 1.8.2.169(Waters), ChemSpider(www.chemspider.com), human metabolome databases(www.hmdb.ca), Metlin database(metlin.scripps.edu)를 사용하여 동정하였다.
GC/MS를 이용하여 얻어진 GC/MS data는 AnalyzerPro를 이용하여 분석하였으며, 분석된 물질의 동정을 위해 GC/MS databases(NIST 11과 Wiley 9 mass spectral libraries)와 n-alkanes를 이용하여 계산된 retention indices(RIs)를 이용하였다.
9. 통계 분석
SIMCA-P+version 12.0.1(Umetrics, Umeå, Sweden)은 UNIFI와 AnlyzerPro를 통해 프로세싱된 LC/MS data와 GC/MS data의 통계분석을 위해 사용되었다. 특히 Partial least squares discriminant analysis(PLS-DA)는 분석한 결과를 시각화하기 위하여 사용되었다. 분석된 PLS-DA를 평가하기 위하여 R2X, R2Y, Q2, permutation test를 사용하였으며, R2X와 R2Y는 goodness of fit measure, Q2Y는 predictive ability, permutation test는 PLS-DA를 교차 검증하였다. 또한 총 페놀화합물 함량 및 대사물질의 relative abundances는 SPSS 25.0(IBM corp., Armonk, NY, USA)의 one-way analysis of variance(ANOVA) with Duncan’s multiple range test(p<0.05)를 이용하여 분석하였다.
결과 및 고찰
1. 미생물 동정
누룩으로부터 미생물을 분리하여 B3 균의 동정을 위해 Molecular Evolutionary Genetics Analysis X(MEGA X) 프로그램 Xenotech(Korea)을 이용하여 분자 유전학적인 계통도를 작성하였다(Fig. 1). 계통도에서 B3 균주는 Aspergillus parasiticus, Aspergillus. flavus, Aspergillus oryzae 등과 높은 상동성을 보였다. MEGA 5.0의 neighbor-joining method를 이용하여 유전적 계통분류를 수행하였다(Tamura K 등 2011). 따라서 B3 균의 분류학적인 위치는 Aspergillus SP. B3로 판단된다.
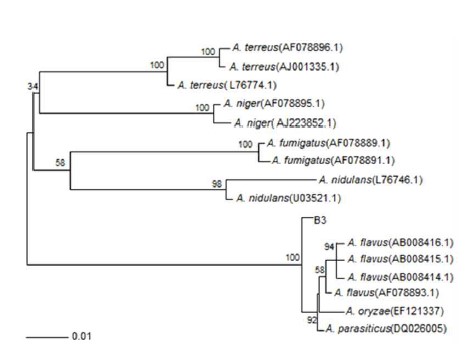
A neighbor-joining phylogenetic tree based on the ITS gene sequence of fungal B3.The neighbor-joining method was used to determine the distance matrix. The bootstrap values are greater than 50% based on 1,000 replicates are listed as percentage at the branch points. Scale bar 0.01 substitutions per 100 nucleotides.
2. 발효차의 총 페놀화합물 함량 변화
B3 균을 처리하여 10일 동안 발효시킨 후, 발효기간에 따른 총 페놀화합물의 함량을 확인한 결과는 Fig. 2에 제시하였다. 발효차의 총 페놀화합물 함량은 발효 전 day 0, 101 mg GAE/g에 비해 발효시간이 증가하면서 감소하여 발효 10일차에는 66 mg GAE/g으로 약 35% 감소하였다. 이러한 결과는 녹차의 폴리페놀 함량 36∼47 mg GAE/g과 비교하여 미생물 발효차의 함량 24 mg GAE/g이 낮다는 선행연구의 결과와 유사하며(Shon MY 등 2004), 미생물을 이용하여 발효차의 발효기간에 따른 총 페놀화합물의 함량을 측정한 연구에서도 균의 종에 따라 차이는 있으나, 발효기간에 따라 총 페놀화합물의 함량이 감소하는 것으로 보고되었다(Kim YS 등 2010).
3. 발효차의 발효 시간에 따른 대사체 분석
B3 균주를 처리하여 10일 동안 발효시킨 발효차의 대사체를 70% 메탄올로 추출한 대사물질들은 UPLC-Q-TOF MS를 이용한 LC/MS와 GC/MS로 분석하였다. LC/MS를 이용하여 분석한 발효차 대사물질들의 프로파일을 분석한 결과, 28개의 물질(theanine, theogallin, phenylalanine, gallocatechin, 3,9-dimethyl xanthine, tryptophan, epigallocatechin, catechin, caffeine, epicatechin, gallocatechin gallate, schaftoside, quercetin 3-glucosyl-rutinoside, kaempferol-3-galactoside-7-rhamnoside, faralateroside, apigenin 7-glucoside, catechin gallate, kaempferol-3-galactoside-7-rhamnoside, kaempferol 3-glucoside, 4, 3’,5’-trihydroXyresveratrol, kaempferol, lysophosphatidylcholine(LPC(18:3), LPC(18:2), LPC(18:1)), harderoporphyrin, pheophorbide A, pyrophaeophorbide a, 13-docosenamide)이 동정되었다(Fig. 3). 또한, GC/MS를 이용하여 유도체화 과정을 통해 전처리한 발효차 대사물질들의 프로파일을 분석한 결과 29개의 피크가 분석되었고, 그 중 fructose가 두 개의 peak로 검출되어 최종적으로 28개 물질(lactic acid, alanine, phosphoric acid, glycerol, glyceric acid, serine, threonine, malic acid, erythritol, aspartic acid, oxoproline, threonic acid, glutamic acid, phenylalanine, xylose, ribitol, glutamine, shikimic acid, citric acid, quinic acid, fructose, glucose, glucitol, glucuronic acid, palmitic acid, myo-inositol, stearic acid, sucrose)이 동정되었다(Fig. 4).
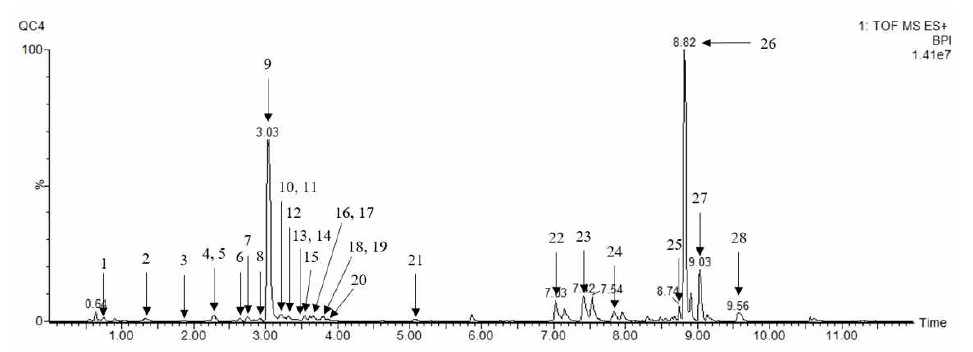
LC-MS profile of metabolites extracted with 70% methanol in the tea fermented with Aspergillus sp. B3 during fermentation.1, theanine; 2, theogallin; 3, phenylalanine; 4, gallocatechin; 5, 3,9-dimethyl xanthine; 6, tryptophan; 7, epigallocatechin; 8, catechin; 9, caffeine; 10, epicatechin; 11, gallocatechin gallate; 12, schaftoside; 13, quercetin 3-glucosyl-rutinoside; 14, kaempferol-3-galactoside-7- rhamnoside; 15, faralateroside; 16, apigenin 7-glucoside; 17, catechin gallate; 18, kaempferol-3-galactoside-7-rhamnoside; 19, kaempferol 3-glucoside; 20, 4,3',5'-trihydroxyresveratrol; 21, kaempferol; 22, LPC(18:3); 23, LPC(18:2); 24, LPC(18:1); 25, harderoporphyrin; 26, pheophorbide a; 27, pyrophaeophorbide a; 28, 13-docosenamide
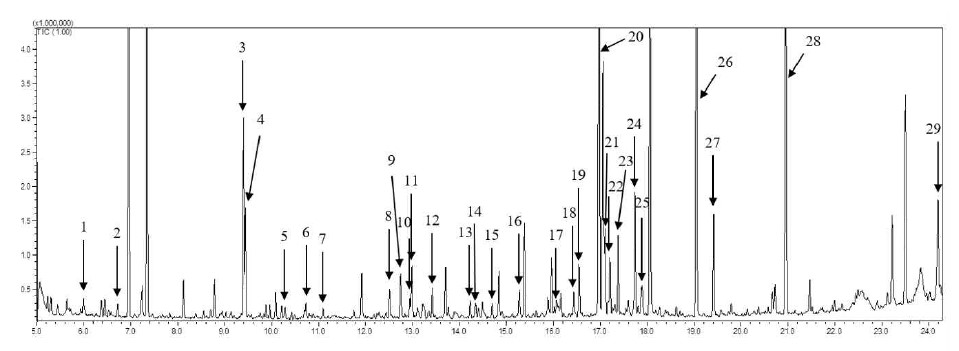
GC-MS profile of metabolites extracted with 80% methanol in the tea fermented with Aspergillus sp. B3 during fermentation.1, lactic acid; 2, alanine; 3, phosphoric acid; 4, glycerol; 5, glyceric acid; 6, serine; 7, threonine; 8, malic acid; 9, erythritol; 10, aspartic acid; 11, oxoproline; 12, threonic acid; 13, glutamic acid; 14, phenylalanine; 15, xylose; 16, ribitol; 17, glutamine; 18, shikimic acid; 19, citric acid; 20, quinic acid; 21, fructose; 22, fructose; 23 glucose; 24, glucitol; 25, glucuronic acid; 26, palmitic acid; 27, myo-inositol; 28, stearic acid; 29, sucrose
4. 발효차의 발효 시간에 따른 당, 유기산, 아미노산, 지방산 함량 변화
본 연구에서는 B3 균을 이용한 발효차의 발효기간에 따른 유리당, 당알코올, 유기산, 아미노산, 지방산을 UPLC-Q-TOF MS를 이용한 LC/MS와 GC/MS로 분석하였고, 유리당과 당알코올, 유기산의 함량 변화는 Fig. 5와 같다. 발효기간에 따른 fructose, glucose의 함량은 발효시간의 경과에 따라 꾸준히 감소하여 fructose의 경우 발효 7일차 이후에는 관찰되지 않았고, glucose의 함량도 감소하여 발효 전에 비해 발효 10일째에는 약 14배 감소하는 경향을 보였으며, sucrose의 함량은 발효시간의 경과에 따라 다소 감소하는 경향을 보였다. Xylose, ribitol, glucitol, erythritol의 경우 발효가 진행되면서 그 함량이 꾸준히 증가하는 경향을 보여 발효 전에 비해 xylose와 erythritol은 각각 약 10배, 5배 증가하였다. 또한, ribitol, glucitol는 발효 전에는 관찰되지 않다가 발효에 의해 새롭게 증가하여 주요 당 관련 물질인 것으로 확인되었다. B3 균의 발효차의 발효기간에 따른 유기산인 citric acid는 감소하는 경향을 보였고, malic acid와 lactic acid인 경우 큰 변화는 없었다. B3 균의 발효차의 발효기간에 따른 아미노산 함량은 phenylalanine, tryptophan, alanine, serine, threonine, aspartic acid, oxoproline에서 발효에 의해 감소하였고, glutamine의 함량만 크게 증가하는 경향을 보였다(Fig. 6).
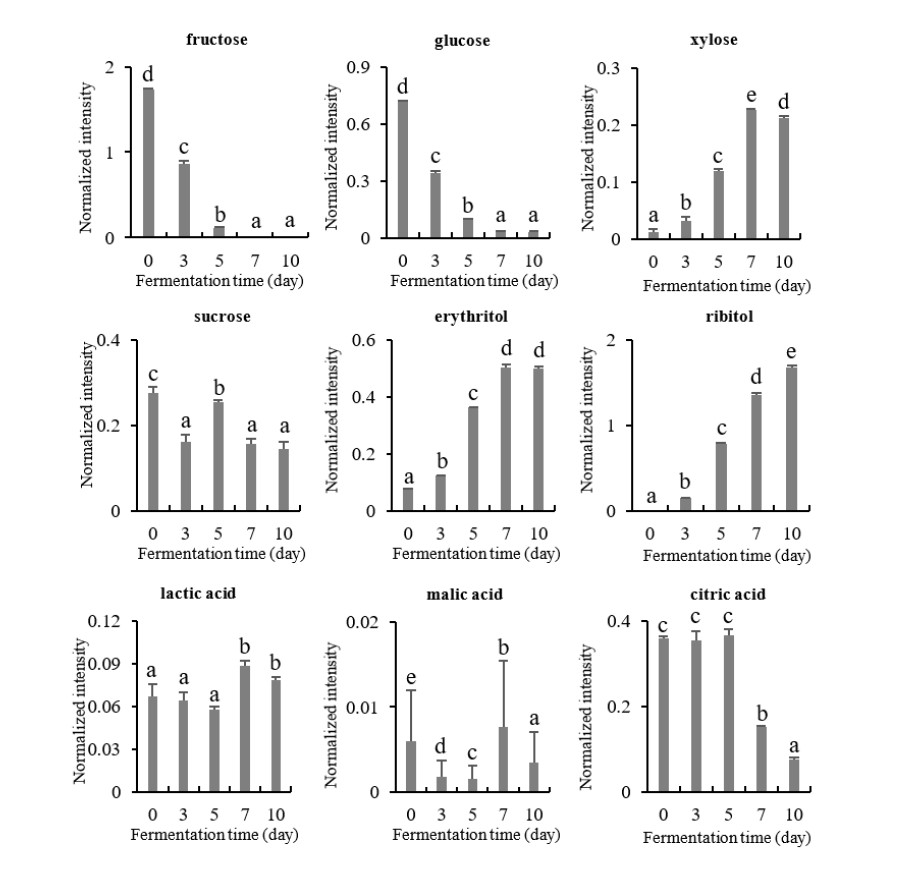
Changes of sugars and organic acids contents in the tea fermented with Aspergillus sp. B3 during fermentation.Values with a same letter (a∼e) are not significantly different by Duncan’s multiple range test at p<0.05.
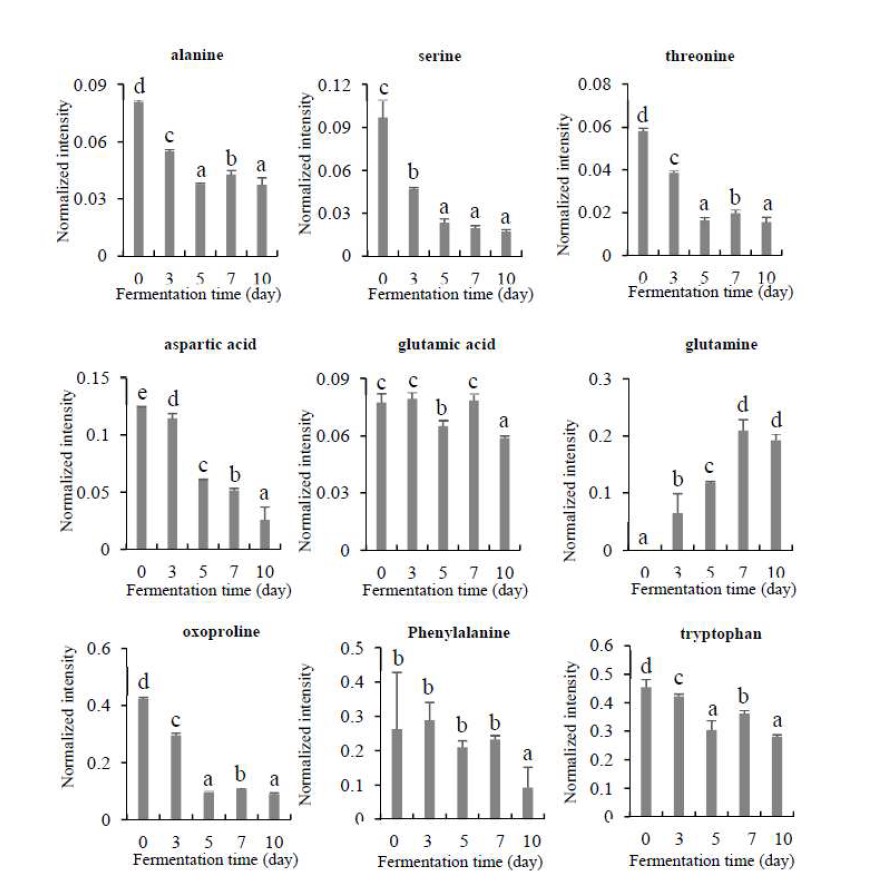
Changes of amino acids content in the tea fermented with Aspergillus sp. B3 during fermentation.Values with a same letter (a∼e) are not significantly different by Duncan’s multiple range test at p<0.05.
Glutamic acid는 거의 변화가 없었고, 본 연구에서 대부분의 아미노산은 발효과정에서 감소하는 경향이 나타났다. Fig. 7에서 B3 균의 발효차의 발효기간에 따른 지방계열 물질 (LPC(18:3), LPC(18:2), LPC(18:1))함량은 발효 전에 비해 발효차에서 약 2∼3배 증가하였지만 발효기간에 따른 차이는 없었고, palmitic acid, stearic acid, glycerol, 13-docosenamide의 함량도 발효시간에 의해 크게 변화되지 않는 것으로 확인되었다.
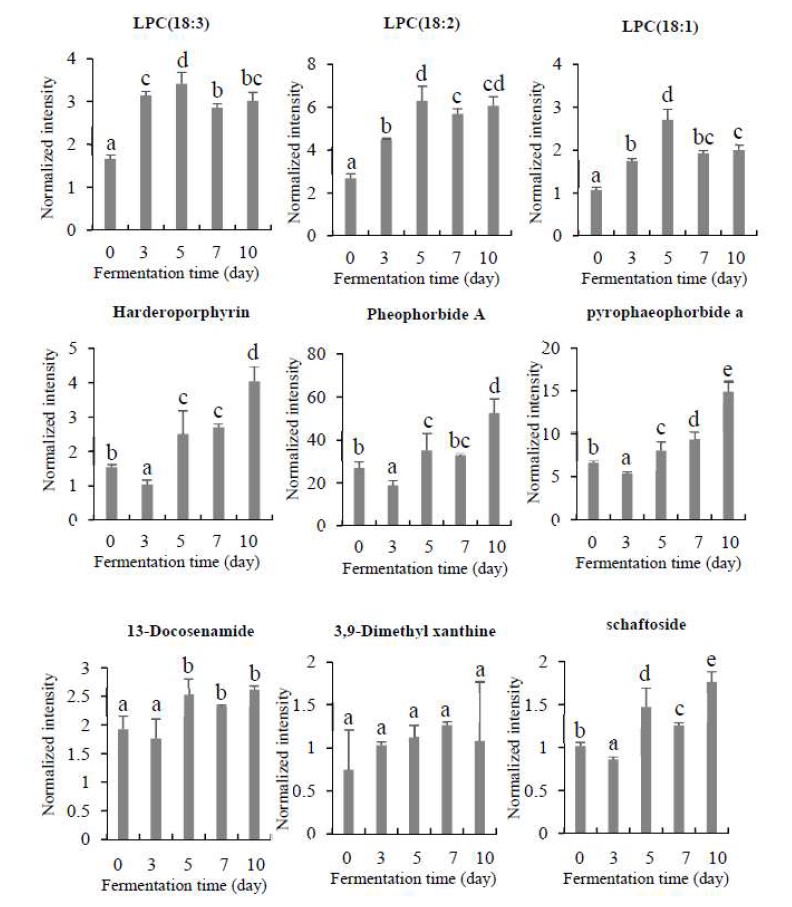
Changes of lipophilic compound contents in the tea fermented with Aspergillus sp. B3 during fermentation.Values with a same letter (a∼e) are not significantly different by Duncan’s multiple range test at p<0.05. LPC: lysophosphatidyl choline.
차에는 fructose, glucose, maltose와 같은 환원당이 함유되어 있으며, 효모를 이용한 발효차와 비발효차를 비교한 연구에서는 발효차의 환원당 함량이 비발효차보다 1.5배 높은 것으로 보고했다(Kang OJ 2010). 이러한 결과는 미생물 발효가 진행됨에 따라 당함량은 감소하고 당알코올의 함량은 증가한 본 연구의 결과와는 차이가 있었다. 차에 함유된 환원당은 열이 가해지면 비효소적 갈변반응으로 항산화 능력을 가진 갈색화합물을 생성하는 것으로 알려져 있으므로 발효 미생물의 종류에 따른 당 성분 변화에 대한 추후 연구가 이루어져야 할 것이다. 또한, 본 연구에서 미생물에 의한 발효과정에서 주요 유기산이 감소하는 경향을 보인 결과는 황차를 모차로 하여 제조한 미생물 발효차의 발효 과정 중에 산도가 감소되는 경향을 보였다는 연구(Lee SJ 등 2015)와 유사하다.
아미노산은 차의 맛과 향에 중요한 역할을 하며, 차의 품질에도 영향을 준다(Kang OJ 2010). 본 연구에서는 누룩에서 분리한 Aspergillus SP.를 이용한 주요 아미노산의 개별 함량이 감소하였다는 결과를 도출하였고, Eurotium cristatum을 이용한 발효차의 연구에서는 총아미노산의 함량이 발효 과정에서 50% 이하로 감소되었다고 보고하였다(Lee SJ 등 2015). 본 연구에서는 개별 아미노산을 분석하였으므로 직접적인 아미노산 양의 변화에 대한 비교는 불가하나, 본 연구의 결과를 통하여 Aspergillus SP.를 이용한 차의 발효과정에서 신맛과 감칠맛을 주는 glutamine의 함량은 크게 증가하고, glutamic acids는 유지된다는 것을 확인할 수 있다. 그 외에도 국내산 발효차와 비발효차의 아미노산 함량을 비교한 선행 연구에서는 발효차의 발효 과정에서 감칠맛 성분이 증가하며(Choi OJ & Choi KH 2003), 효모를 이용한 발효차와 비발효차를 비교한 연구에서는 발효차의 유리아미노산 함량이 비발효차보다 8.5배 높은 것으로 보고했다(Kang OJ 2010). 이렇듯 미생물을 이용한 발효차의 경우, 미생물의 종류에 따라 발효과정에서 대사되는 주요 아미노산의 조성이 달라 아미노산의 종류도 다른 것으로 보고되고 있으므로, 다양한 종의 미생물을 이용한 연구가 더 필요한 것으로 보인다.
5. 발효차의 발효 시간에 따른 폴리페놀, 카테킨류, 카페인 함량 변화
본 연구에서는 B3 균을 이용한 발효차의 발효기간에 따른 폴리페놀, 카테킨류 및 카페인을 UPLC-Q-TOF MS를 이용한 LC/MS와 GC/MS로 분석하였고, 발효기간에 따른 폴리페놀 함량 변화는 Fig. 8과 같다. B3 균을 이용하여 발효차의 발효기간에 따른 폴리페놀 함량 변화는 Theogallin의 경우 조금씩 감소하다가 7일째부터는 관찰되지 않았다. Gallocatechin gallate, shikimic acid, quinic acid, kaempferol, Kaempferol과 kaempferol-3-galactoside-7-rhamnoside, quercetin 3-glucosyl-rutinoside, faralateroside 함량은 발효시간에 따라 감소했으며, Schaftoside는 발효에 의해 조금씩 증가하는 경향을 보였다. 발효 전에는 관찰되지 않았던 4,3’,5’-trihydroxyresveratrol는 발효과정에서 꾸준히 증가하여 발효 10일째는 발효차의 주요 이차대사산물들 중 하나로 관찰되었다. Catechin 계열의 물질들의 함량은 발효 초기에 많이 나왔다가 점차 감소하였으며, epicatechin과 epigallocatechin인 경우 발효 초기에 많이 나왔다가 발효 7일째부터에 감소하는 경향을 보였다(Fig. 9). Caffeine은 발효에 의해 다소 증가하는 것으로 확인되었다.
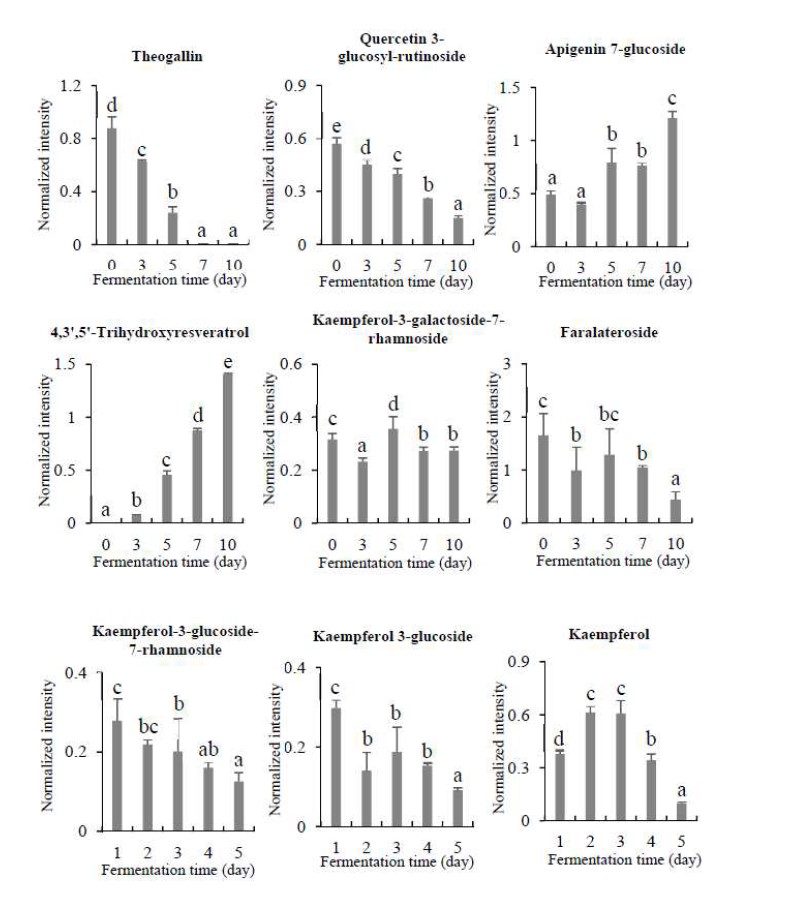
Changes of polyphenol metabolite contents in the tea fermented with Aspergillus sp. B3 during fermentation.Values with a same letter (a∼e) are not significantly different by Duncan’s multiple range test at p<0.05.
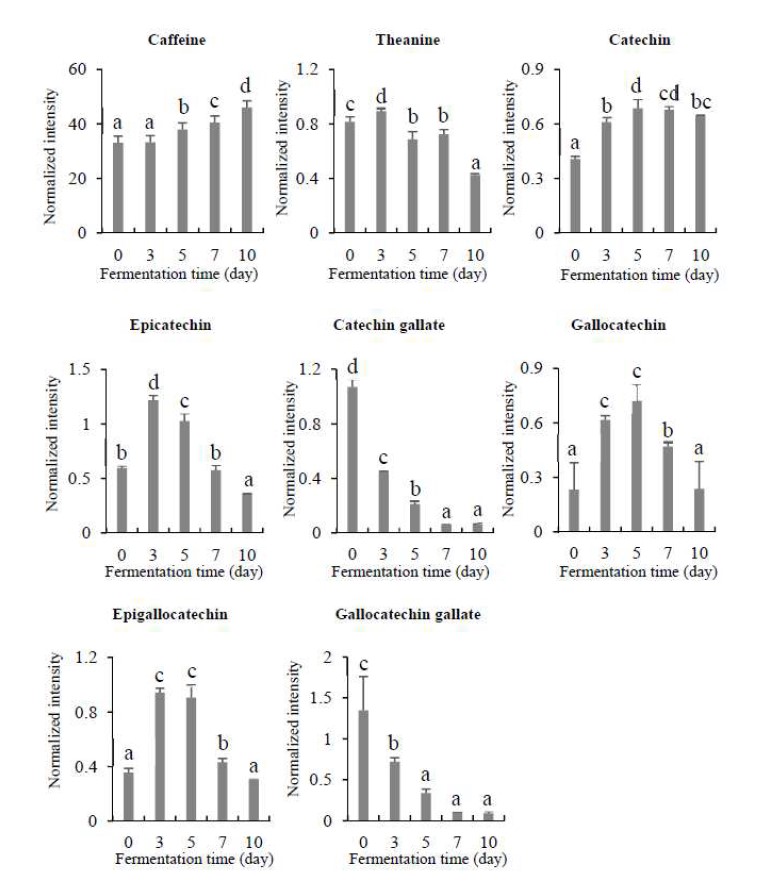
Changes of caffeine, theanine, catechin contents in the tea fermented with Aspergillus sp. B3 during fermentation.Values with a same letter (a∼e) are not significantly different by Duncan’s multiple range test at p<0.05.
Polyphenol 계열의 catechin 물질들은 차의 가장 대표적인 기능성 성분으로서, 차의 기능적인 우수성을 제시하는 지표인자로 인식되고 있어 미생물 발효차의 중요한 지표 성분으로 인식되고 있다. Catechin 함량은 차의 쓴맛과 떫은맛을 내는데, 발효가 진행되는 과정에서 감소되며(Terada S 등 1987), 떫은맛을 내지 않는 온화한 쓴맛의 epigallocatechin은 발효과정 중에 증가하여 차의 떫은맛이 다소 저감되었을 것이라는 연구 결과(Lee SJ 등 2015)는 대부분의 카테킨류 물질이 발효기간 중 감소되었다는 본 연구의 결과와 유사하다. 이렇듯 본 실험의 결과는 카테킨류의 함유량이 녹차에서 가장 많고, 후발효차에서는 그 함량이 감소한다는 선행연구들의 결과를 뒷받침하고 있다(Lee Y 등 1998; Park J 등 1998; Jeong CH 등 2009). 또한, 발효차의 caffeine 함량은 질소의 함량이 높을수록 증가하고, 채엽에서 위조 사이에 증가한다는 연구결과와 유사하다(Ryu YS 2016). 그러나 발효차의 caffeine 함량은 발효 전과 후에도 감소의 변화가 적은 연구 결과도 있다(Lee SJ 등 2015). 본 연구에서는 발효가 진행되면서 caffeine 함량이 다소 증가하는 것으로 나왔다.
본 연구에서는 누룩을 이용한 미생물 발효차의 발효기간별 이차 대산물 생성을 확인하였으며, 발효기간에 따라 다양한 대사산물의 함량이 크게 변화한다는 것으로 확인하였다. 또한 선행 발효차 연구 결과와의 고찰을 통하여 미생물의 종류와 특성에 따라서도 각기 다양한 성분 변화들이 나올 수 있다는 것을 확인하였다. 그러므로 본 연구의 결과는 누룩으로부터 분리한 미생물을 이용한 발효차의 대사체를 분석함으로써, 차의 감칠맛을 높이는 개별 아미노산의 함량을 높이고, 떫은맛을 저감시킬 수 있는 한국형 발효차 미생물로서 Aspergillus sp.의 가능성을 확인한 데에 그 의의가 있으며, 본 연구의 결과는 누룩을 이용한 발효차를 연구하는 기초 자료로 이용될 수 있을 것으로 보인다.
요약 및 결론
본 연구는 고품질 미생물 발효차를 만들기 위해서 누룩으로부터 미생물을 분리하여 동정하였다. 누룩에서 분리한 미생물은 Internal transcribed spacer(ITS) 분석을 통하여 Aspergillus sp.로 동정되었으며, Aspergillus sp. B3로 명명하였다. 동정된 미생물을 찻잎에 접종하여 차의 변화를 연구하고, 여기서 생성되는 대사체를 발효 기간에 따라 분석했다. B3 균주를 이용하여 찻잎에 접종하여 0, 3, 5, 7, 10일 간의 발효기간에 따른 발효차의 총폴리페놀 함량을 비교한 결과, 접종 전 0일차보다 10일차에는 35% 감소하였다. 발효차 대사물질들의 PLS-DA score plot 결과와 UPLC-Q-TOF MS를 LC/MS와 GC/MS을 이용한 결과에서 각각 28개와 29개 물질이 동정되었다. 발효차의 발효기간에 따른 단순당과 유기산의 함량은 감소하고, 당알코올의 함량은 증가했다. 아미노산 중 glutamine의 함량은 크게 증가하였고, alanine, serine, threonine, aspartic acid, oxoproline 함량은 감소했다. 지방산 중 lysophosphatidylcholine(18:3), lysophosphatidylcholine(18: 2), Lysophosphatidylcholine(18:1) 함량은 발효차에서 증가하였고, palmitic acid, stearic acid, glycerol, 13-docosenamide의 함량은 변화가 없었다. 발효차의 catechin 계열 물질들의 함량은 감소하였다. 본 연구의 결과는 Aspergillus sp. B3를 이용한 발효차의 연구와 그 이차 대산물에 대한 기초 연구 자료로 이용될 수 있을 것으로 보이며, 향후 발효기간에 따라 다양한 미생물 발효차의 연구를 통하여 한국형 미생물 발효차를 제조하는 데 의미가 있다.
References
-
Choi OJ, Choi KH (2003) The physicochemical properties of Korean wild teas (green tea, semi-fermented tea, and black tea) according to degree of fermentation. J Korean Soc Food Sci Nutr 32(2): 356-362.
[https://doi.org/10.3746/jkfn.2003.32.3.356]

-
Feng Q, Torii Y, Uchida K, Nakamura Y, Hara Y, Osawa T (2002) Black tea polyphenols, theaflavins, prevent cellular DNA damage by inhibiting oxidative stress and suppressing cytochrome P450 1A1 in cell cultures. J Agric Food Chem 50(1): 213-220.
[https://doi.org/10.1021/jf010875c]

-
Gomes A, Vedasiromoni J, Das M, Sharma R, Ganguly D (1995) Anti-hyperglycemic effect of black tea (Camellia sinensis) in rat. J Ethnopharmacol 45(3): 223-226.
[https://doi.org/10.1016/0378-8741(95)01223-Z]

- Jeong CH, Kang S-T, Joo O-S, Lee S-C, Shin Y-H, Shim K-H, Cho S-H, Choi S-G, Heo H-J (2009) Phenolic content, antioxidant effect and acetylcholinesterase inhibitory activity of Korean commercial green, puer, oolong, and black teas. Korean J Food Preserv 16(2): 230-237.
-
Jung YM, Choi MJ (2019) Black tea intake in relation to BMI and depression in adult women. J East Asian Soc Diet Life 29(5): 436-443.
[https://doi.org/10.17495/easdl.2019.10.29.5.436]

- Kang OJ (2010) Production of fermented tea with Rhodotorula yeast and comparison of its antioxidant effects to those of unfermented tea. Korean J Food Cookery Sci 26(4): 422-427.
-
Kim DW, Kim BM, Lee HJ, Jang GJ, Song SH, Lee JI, Lee SB, Shim JM, Lee KW, Kim JH (2017) Effects of different salt treatments on the fermentation metabolites and bacterial profiles of Kimchi. J Food Sci 82(5): 1124-1131.
[https://doi.org/10.1111/1750-3841.13713]

-
Kim MG, Oh MS, Jeon JS, Kim HT, Yoon MH (2016) A study on antioxidant activity and antioxidant compound content by the types of tea. J Food Hygiene Safety 31(2): 132-139.
[https://doi.org/10.13103/JFHS.2016.31.2.132]

- Kim SH, Lee MH, Jeong YJ (2014) Current trends and development substitute tea and plan in the Korean green tea industry. Food Industry Nutr 19(1): 20-25.
-
Kim SY, Sang MK, Weon HY, Jeon YA, Ryoo JH, Song J (2016) Characterization of multifunctional Bacillus sp. GH1-13. Korean J Pesticide Sci 20(3): 189-196.
[https://doi.org/10.7585/kjps.2016.20.3.189]

-
Kim YS, Choi GH, Lee KH (2010) Changes of chemical components of fermented tea during fermentation period. J Korean Soc Food Sci Nutr 39(12): 1807-1813.
[https://doi.org/10.3746/jkfn.2010.39.12.1807]

-
Kuo KL, Weng MS, Chiang CT, Tsai YJ, Lin-Shiau SY, Lin JK (2005) Comparative studies on the hypolipidemic and growth suppressive effects of oolong, black, pu-erh, and green tea leaves in rats. J Agric Food Chem 53(2): 480-489.
[https://doi.org/10.1021/jf049375k]

- Lee JY, Wang LF, Baik JH, Park SK (2007) Changes in volatile compounds of green tea during growing season at different culture areas. Korean J Soc Food Sci 39(3): 246-254.
-
Lee SI, Lee YK, Kim SD, Yang SH, Suh JW (2012) Dietary effects of post-fermented green tea by Monascus pilosus on the body weight, serum lipid profiles and the activities of hepatic antioxidative enzymes in mouse fed a high fat diet. J Appl Biol Chem 55(2): 85-94.
[https://doi.org/10.3839/jabc.2011.064]

-
Lee SJ, Kim EJ, Kim JC, Jeong YS, Lee JG, Lee KS, Ryu CH (2015) Change of the chemical properties of microbial-fermented tea using Eurotium cristatum. J Agric Life Sci 49(6): 269-278.
[https://doi.org/10.14397/jals.2015.49.6.269]

-
Lee SY, Park SL, Nam YD, Yi SH, Lim SI (2013) Anti-diabetic effects of fermented green tea in KK-A y diabetic mice. Korean J Soc Food Sci 45(4): 488-494.
[https://doi.org/10.9721/KJFST.2013.45.4.488]

- Lee Y, Ahn M, Hong K (1998) A study on the content of general compounds, amino acid, vitamins, catechins, alkaloids in green, oolong and black tea. J Fd Hyg Safety 13(4): 377-382.
- Oh CK, Oh MC, Kim SH (2000) Desmutagenic effects of extracts from green tea. Korean J Soc Food Sci 16(5): 390-393
- Park J, Choi H, Park K (1998) Chemical components of various green teas on market. J Kor Tea Soc 4(2): 83-92.
-
Park JH, Kim Yh, Kim SH (2012) Green tea extract (Camellia sinensis) fermented by Lactobacillus fermentum attenuates alcohol-induced liver damage. Biosci Biotechnol Biochem 76(12): 2294-2300.
[https://doi.org/10.1271/bbb.120598]

-
Ryu KH, Lee HJ, Park SK (2012) Studies on the effect of low winter temperatures and harvest times on the volatile aroma compounds in green teas. Korean J Soc Food Sci 44(4): 383-389.
[https://doi.org/10.9721/KJFST.2012.44.4.383]

- Ryu YS (2016) A study on methods to strengthen aroma of black tea. Korea Tea & Tao Research Institute 2: 89-98.
-
Shon MY, Kim SH, Nam SH, Park SK, Sung NJ (2004) Antioxidant activity of Korean green and fermented tea extracts. J Life Sci 14(6): 920-924.
[https://doi.org/10.5352/JLS.2004.14.6.920]

-
Singleton VL, Orthofer R, & Lamuela-Raventós RM (1999) Analysis of total phenols and other oxidation substrates and antioxidants by means of Folin-Ciocalteu reagent. Methods Enzymol 299: 152-178.
[https://doi.org/10.1016/S0076-6879(99)99017-1]

- Sung KC (2006) A study on the pharmacetical characteristics and analysis of green-tea extract. J Korean Appl Sci Technol 23(2): 115-124.
-
Tamura K., Peterson, D., Stecher, G., (2011) MEGA5: Molecular evolutionary genetics analysis using maximum likelihood, evolutionary distance, and maximum parsimony methods. Mol Biol Evol 28: 2731-2739.
[https://doi.org/10.1093/molbev/msr121]

-
Terada S, Maeda Y, Masui T, Suzuki Y, Ina K (1987) Comparison of caffeine and catechin components in infusion of various tea (green, oolong and black tea) and tea drinks. Nippon Shokuhin Kogyo Gakkaishi 34(1): 20-27.
[https://doi.org/10.3136/nskkk1962.34.20]

